Tek B Sapkota1, ML Jat1, RK Jat1, 2 P. Kapoor1 and Clare Stirling3
Abstract Enhancing food security while contributing to mitigate climate change and preserving the natural resource base and vital ecosystem services requires the transition to agricultural production systems that are more productive, use inputs more efficiently, are more resilient to climate variability and emit fewer GHGs into the environment. Therefore, quantification of GHGs from agricultural production systems has been the subject of intensive scientific investigation recently to help researchers, development workers and policy makers to understand how mitigation can be integrated into policy and practice. However, GHG quantification from smallholder production system should also take into account farm productivity to make such research applicable for smallholder farmers. Therefore, estimation of farm productivity should also be an integral consideration when quantifying smallholder mitigation potential. A wide range of methodologies have been developed to estimate crop yields from smallholder production systems. In this chapter, we present the synthesis of the state-of-the-art of crop yield estimation methods along with their advantages and disadvantages. Besides plot level measurements and sampling, use of crop models and remote sensing are valuable tools for production estimation but detailed parameterization and validation of such tools are necessary before such tools can be used under smallholder production systems. The decision on which method to be used for a particular situation largely depends on the objective, scale of estimation and desired level of precision. We emphasize that multiple approaches are needed to optimize the resources and also to have precise estimation at different scales.
Table of contents:
8.1 Introduction
8.2 Crop productivity estimation
8.3 Critical analysis and comparison of yield estimation methods with regards to cost, scale and accuracy
8.4 Conclusion
Author affiliations
References
8.1 Introduction
The challenge of agricultural sustainability has become more intense in recent years with the sharp rise in the cost of food and energy, climate change, water scarcity, degradation of natural ecosystems and biodiversity, the financial crisis and expected increase in population. With increasing demands for food and agricultural products, intensification of smallholder production system becomes increasingly necessary. Recently, agricultural technologies which increase food production sustainably at the same time offering climate change adaptation and mitigation benefit collectively known as climate smart agricultural (CSA) practices have been the subject of scientific investigation. CSA practices are designed to achieve agricultural sustainability by implementation of sustainable management practices that minimize environmental degradation and conserve resources while maintaining high-yielding, profitable systems, and also improve the biological functions of the agro-ecosystems. However, simultaneous quantification of productive, adaptive and mitigative production systems is still scanty and scattered.
Understanding the greenhouse gas (GHG) fluxes between agricultural fields and the atmosphere is essential to know the contribution of farm practices to GHG emissions. However, quantification of GHG from agricultural production systems in smallholder systems is meaningless if the livelihood effects of those activities are ignored (Linquist et al. (2012). As farm productivity is inextricably linked to food security of smallholder farmers in developing countries, the importance of productivity must be taken into account in mitigation decision-making and the GHG research agenda supporting those decisions. Most of the GHG emission studies, so far, highlight the emission reduction potential of particular activities without paying due attention on yield and livelihood benefits for smallholder production (Rosenstock et. al., 2013). The benefit of smallholder production systems, in terms of reduced emissions and increased carbon sequestration should, therefore, be assessed taking household benefits such as resilience led-productivity enhancement and input use efficiency in due consideration. In this chapter, we focus on comparative analysis of yield estimation methods from field to landscape level under smallholder production practices.
8.2 Crop productivity estimation
Various methods have been developed for quantifying production and productivity of agricultural systems at research plot level and also for agricultural statistics at regional and national level. However, as agricultural production systems are changing to address new challenges, for example, climate smart agricultural practices, the yield estimation methods developed and tested for a particular production system may not adequately reflect the yield for new production systems. For example, the standard crop cut method using sampling frames may create significant bias and error if applied to crops planted in raised beds in row geometry.
Standardization of crop yield estimation methods, particularly in the context of smallholder production system at various scales (field, farm to landscape scale) helps not only to obtain accurate agricultural statistics but also in assessing suitability of low-emission agricultural practices under various production environments. Accurate yield estimation allows trade-off analysis on crop yield and emission reduction of particular production practices thereby helping appropriate mitigation decision making without compromising smallholder livelihood and rural development (Rosenstock et al., 2013). This is particularly important in the context that a significant proportion of developing countries have expressed an interest in GHG mitigation in the agriculture sector (Wilkes et al., 2013). Here, we present various yield estimation methods followed by comparative analysis of those methods at various scales i.e. from field to landscape level.
8.2.1 Crop cuts
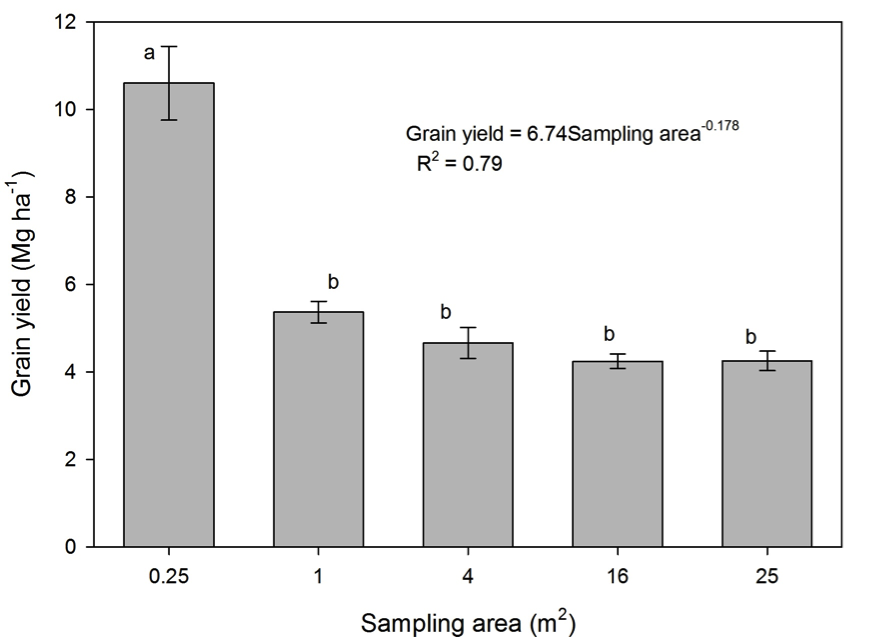
Estimating crop yield by sampling a small subplot within cultivated field was developed in the 1950s in India (Fermont and Benson, 2011) and rapidly adopted as the standard method of crop yield estimation, known popularly as the crop cut method. In this method, yield in one or more subplots is measured and total yield per unit area is calculated as total production divided by total harvested area in the crop cut plot or subplot. The number of sub-plots and area of each sub-plot to be selected for yield estimation through crop cuts depends on the resources availability and level of precision required in the estimation. In practice, one to five sub-plots of 0.25 m2 to 50 m2 are used for yield estimation. In on-farm research conducted by CIMMYT, use of a 0.5 m by 0.5 m sampling frame overestimated the wheat yield by more than two times as compared to 1 m2 or larger sampling frame (Fig. 8.1). This finding suggests that when estimating crop yield by using crop cut method, the size of sampling plot should be at least 1 m2. In the field with variable crop performance, it is advisable to use even larger sampling frame or increase the number of subplots to be harvested for yield estimation. For better result, the person throwing the sampling frame in the field should be blindfold. Alternatively, a person independent of the research or demonstration should throw the sampling frame in the field to minimize the bias.
8.2.2 Farmers’ survey
Estimating crop production through farmers’ interviews involves asking farmers to estimate or recall the yield for an individual plot, field or farm. It can be done before harvesting (estimate) or after harvesting (recall). Before harvesting, farmers are asked to predict what quantity they expect to harvest. Farmers will base their predictions of expected yield on previous experiences, by comparing the current crop performance to previous crop performances. Singh (2013) argue that yield estimation surveys following this method should be made at maximum crop growth stage. This helps enumerators/extension worker to verify the farmer’s response by visual observation of the crop. Postharvest estimations are commonly made at the farmer’s house or at the site where the harvest is stored in order for the enumerator to cross-check the estimates with the harvested products. Postharvest surveys should be carried out as soon as farmers harvest the crop, although Erenstein et al. (2007) reported that farmers can recall yield for up to three-to-six previous seasons.
To estimate crop yield, production data obtained from farmer recall or prediction require division by the plot area from which the crop was or will be harvested. This introduces an additional source of error. To remove this error source, Fermont et al. (2009) obtained a direct estimate of average crop yield by asking farmers to estimate the number of local harvest units they would have obtained from a well-known unit of land, often the farm compound, if it had been planted to a specific crop.
8.2.3 Estimating crop yield by using grain weight (test weight)
Table 8.1 Thousand grain weight of some example crops
|
Crop |
1000-grain weight (g) |
Source |
|
Wheat |
30-45 |
|
|
Rice |
18-23 |
|
|
Lentils |
30-50 |
|
|
Field pea |
200 |
|
|
Chickpea (desi) |
180 |
|
|
Chickpea (kabuli) |
380-420 |
|
|
Maize |
237-268 |
Estimating crop yield by using pre-estimated test weight is one of the easiest and quickest methods which can be used in a number of situations and farm conditions. This is similar to the crop cut method but does not require harvesting and subsequent weighing of the sampled area. By using a sampling frame, count number of earheads/pods in one meter square area at least in 5-7 times within a plot whose yield is to be determined and get average number of heads/pods per meter square area. Similarly, count the number of grains in 20-25 heads/pods and take the average. The yield of the crop can then be determined by using the following formula. The 1000-grain weight can be taken from previous data or from published figures (Table 8.1).
 The 1000-grain weight of crops is influenced by many factors such as genotype, management and environment. Therefore, care should be taken to use appropriate 1,000-grain weight value based on the variety grown and growing condition. Estimation accuracy, regardless of method, depends on the accuracy of observations taken in the field. Counts of grain per head and heads per square meter area must be accurate and taken randomly at enough locations (at least 5) to provide an average of the whole field.
8.2.4 Whole plot harvest
Harvesting the entire field to determine crop yield is normally done in trial plots, excluding one or more boundary lines that may not reflect the tested treatment due to boundary effects. This method can be employed in experimental or demonstration plots. It can also be used to estimate yield from small-scale farmers’ field if farmers are willing to cooperate but is too costly for larger samples of farmers. The complete harvest method is considered the most accurate and often used as a standard for comparing effectiveness and accuracy of other methods. Crops that have a defined maturity date, such as cereals or legumes with a determinate growth habit, can be harvested in a single operation whereas crops with staggered maturity such as banana, cassava and legumes or with an indeterminate growth habit like common bean, cowpea and mungbean require multiple harvests per plot. In many cases, a farmer gathers all his/her produces from his/her land in one place, thresh there and take home after weighing. In such cases, it is easy to estimate the yield by dividing the total yield by the total area that farmers own.
8.2.5 Sampling for harvest unit
This is similar to yield estimation through whole plot harvest except that only a few samples out of the total harvest are weighed. In this method, the number of units such as sacks, baskets, bundles etc. are counted after the farmer harvests his/her plot. A number of harvest units are then randomly selected and weighed to obtain an average unit weight. Total harvest of the plot is obtained by multiplying total number of units harvested by the average unit weight. Crop productivity can then be calculated by dividing total production by the area from where the production came from. Ideally, sampling of harvest units is done just before storage and includes a measurement of the moisture content of the harvested product (Casley and Kumar, 1988). This method can be used on larger samples than is possible with crop-cut or whole-plot harvest method. However, the crops must be harvested all at once for this method to be applicable.
An alternative method which requires the physical threshing of only a small sample to estimate yield, biomass and other yield related parameters has been developed by Castellanos-Navarrete et al. (2013). This is rather a simple procedure that dramatically reduces the labor and large-scale threshing required to obtain reliable yield and associated yield-related parameters. The methodology can also be used for any situation and any cereal crop. It can be readily applied for on-farm research situations where samples are taken in the field and then transported back to a central point for threshing. Harvest should be done as soon after physiological maturity as possible. Here, after harvesting the crop from sample harvest area, 50-200 tillers are selected randomly for fresh and dry biomass weight, grain weight and test weight. The yield and yield-related parameters are then determined by using the relationship the determined parameters and harvest area. Step-by-step procedures for yield estimation following this method can be found in Castellanos-Navarrete et al. (2013).
8.2.6 Expert assessment
Sometimes crop yield is estimated by summarizing the opinions of field agronomists, extension agents and researchers (Dumanski and Onofrei, 1989). These experts are often able to estimate crop production or yield by visually assessing the crop condition such as color, plant vigour, plant density etc. in the field. This is known as eye assessment. Eye assessment can be combined with field measurement and empirical formulas, collectively known as the expert assessment method. The expert assessment method can be applied on a relatively large scale as compared to the crop-cut method but on smaller scale than farmer’s’ estimate. However, eye estimation of crop yield requires not only practical but also technical familiarity with the yield potential of different varieties of crops in different environments. Therefore, accuracy of the yield assessment, in this method, will strongly depend on the level of expertise of the personnel involved in the assessment. Care should be taken not to use extension worker as expert for yield estimation in their own work area as they may be biased to demonstrate their own work (Casley and Kumar, 1988).
8.2.7 Crop cards
The crop card method is a refined version of the farmer recall procedure to obtain more reliable harvest estimates for crops with an extended harvest period or multiple harvests, such as cassava, banana, cowpea, sweet potato etc. As farmers may have problems in accurately remembering the amounts they harvested over time from one or several plots, this method helps them by keeping the written record of all plots. In this method, each farmer in a survey is given a set of crop cards where he/she records the quantity of crop in each harvest, which can then be added up to calculate the total harvested yield. However, this may be challenging to use in smallholder production contexts of developing countries due to high illiteracy rates and lack of adequate manpower for regular monitoring (Ssekiboobo, 2007).
8.2.8 Crop modelling
Crop modelling is widely used to estimate average biological yields in the conditions of smallholder farmers. Empirical-statistical crop models establish a relationship between yield and environmental factors from long-term data sets and use the established relationship to predict crop yield at regional or national levels based on environmental data (Park et al., 2005). Empirical crop growth models are relatively simple to develop, but these models cannot take into account the temporal changes in crop yields without long-term field experiments (Jame and Cutforth, 1996). Furthermore, the derived functional equation is locally specific, and it is thus difficult to extrapolate to other areas unless environmental conditions are similar. Many of such models embody a number of simplifications. For example, weeds, diseases and insect pests are assumed to be controlled and there are no extreme weather events such as heavy storms.
Process-based crop models, on the other hand, estimate crop yield on the basis of daily gains in biomass production by taking into account all known interactions between physiological processes and environmental conditions (Sawasawa, 2003). Because process-based models explicitly include plant physiology, agro-climatic conditions, and biochemical processes, these models are able to simulate both temporal and spatial dynamics of crop yields thus have higher extrapolation potential than empirical models.
8.2.9 Allometric models
Allometric models are mathematical relationships between plant morphological characteristics and crop yield. The morphological characters can be measured on a selected number of plants which then can be used to predict biological yield in field. Allometric models should be based on variables that can be quantified easily using rapid, inexpensive, and non-destructive methods of data collection (Fermont and Benson, 2011). For bananas in Uganda, Wairegi et al. (2009) found that a multivariate model using girth of the pseudo-stem at base and at 1 m, the number of hands, and the number of fingers gave a robust prediction of bunch weight. Tittonell et al. (2005) used plant height and ear length to predict maize yields in western Kenya. In cereal crops, number of tillers per unit area, ear or spike length, number of grains per spike and 1000 grain weight-commonly known as yield attributing characters-can be determined and used to estimate the crop yield. Data collection is one of the pre-requisites of this method although data collection may be less labour intensive than with the crop cut method.
8.2.10 Remote sensing
Use of remote sensing to estimate biological crop yield is being explored in many countries and likely will become the basis of agricultural statistics in the future (Zhao et al., 2007). Crop yield estimation using remote sensing is based on the principle of spectral reflectance of green plants, which can be captured in satellite images as spectral data, depends on the state, structure and composition of the plant. The spectral data can be used to construct several vegetation indices such as normalized difference vegetation index (NDVI) which indicates the green biomass that can be used as proxy indicator of the yield (Prasad et al., 2006). The limitation in the use of satellite images to estimate crop yields of smallholder farmers is that the resolution of available satellite imagery (pixel size) is not sufficiently detailed to capture the variability of crops and crop performance in smallholder fields, which often are less than 0.1 ha in size and sometimes intercropped (Fermont and Benson, 2011). In India, for example, vegetation indices from satellite images show only a moderate correlation (R2 between 0.45 to 0.54) with crop cut data (Singh, 2013).
8.3 Critical analysis and comparison of yield estimation methods with regards to cost, scale and accuracy
A comparison of the wide range of methodologies to estimate crop production in terms of their cost effectiveness, suitability for different scales from field to landscape and sources of errors or biases is presented in Table 8.2. A strong advantage of the crop-cut method is that the area of the cut is known and thus does not introduce an error into the final yield computation. It has been a standard method for yield estimation recommended by organizations such as the Food and Agriculture Organization of the United Nations for years. However, crop cuttings may suffer from serious limitation due to heterogeneity of crop conditions within farmers’ plots. In crop cuts, enumerators have the tendencies not to sample locations with poor crop stand, leave border areas where crop yield is generally lower than in the middle of the plot and include the plant falling at the edge of sampling frame. A study done in Bangladesh found that even with best-educated enumerators, crop-cut estimates exceeded actual yield by 20 percent whereas farmers’ estimates of production were lower (Diskin, 1997). Further, crop cut only estimates biological yield without taking into account postharvest losses and is therefore unable to estimate economic yield, which is of most interest to farmers. All these tendencies contribute to upward bias when extrapolating results to a larger area. Further, using a large weighing balance to weigh smaller quantities from crop cuts may sometimes introduce measurement errors. This method is costly and time consuming, and not suitable for heterogeneous crop performance (typical characteristics of smallholder production systems) and staggered harvesting as this is a one-point-in-time measurement.
Table 8.2 Comparison of various methods of crop production estimation with regard to their cost effectiveness, scale and accuracy
|
Method |
Cost effectiveness |
Scale |
Precision in estimation, errors and biases |
|
Crop cut |
Time and labour intensive |
Field, farm and sometime landscape level |
Tendency of over estimation |
|
Farmer’s Estimate |
Cheap and quick method that saves time and money |
Farm to landscape |
Fairly accurate estimation but needs adequate supervision. Subjective. Sometimes farmers deliberately overestimate or underestimate |
|
Sampling harvest unit |
Cost effective |
Farm to landscape |
Error prone in the condition where farmers harvest from multiple area at time and not possible with staggered harvesting |
|
Whole plot harvest |
Cost intensive, labour intensive |
Plot level, farm level, case study |
Almost bias/error free |
|
Expert Assessment |
Moderately cost effective |
From farm to landscape level |
Chances of error increases if different team of experts are used or extension people are used to estimate yield in their own area. Subjective |
|
Crop cards |
Cost and labour intensive |
Field to farm level |
Bias due to illiteracy, use of local units etc |
|
Crop Modelling |
Cost effective |
Landscape |
Less if adequately parameterized and calibrated. Do not include induced improvements in agricultural technology. |
|
Purchaser’s/Insurance record |
Cost effective |
Field scale |
Suitable for cash crops only with not household consumption |
|
Allometric models |
Cost effective |
Field scale |
Suitable for few crops only |
|
Remote sensing |
Cost effective |
Landscape |
Chances of error in cases where different crops have same signature |
The farmers’ estimation method does not require laborious measurements, and therefore this method is time- and cost-efficient and is suitable for estimation at larger scales. For years, it was assumed that farmers’ estimates were too subjective and unreliable and when differences appeared between crop cut and farmers’ production estimates, it was attributed as farmers’ error. However, research in 1980s suggested that farmers’ estimation may be just as accurate as crop cut, at least for determining total farm production (Murphy et al., 1991). However, literacy levels of farmers and non-standard harvest units pose serious drawbacks in its use in smallholder production systems of developing countries. Farmer may use part of their produce as in-kind payment to their labour which they may not count in their estimation leading to underestimation. Further, many farmers consciously over- or underestimate in the case of suspected benefits such as food aid or penalties such as taxes (Diskin, 1997). Expert assessment can be relatively error free if the same team of experts can be used throughout the study (Rozelle, 1991). However, finding a large number of experts with required practical and technical experience to estimate relative performance of different crops/varieties under different environments is a challenge to employ this approach at larger scales. Furthermore, both farmer’s estimation and expert assessment are subjective and amenable to several non-sampling errors. Therefore, it is advisable to combine these methods with other methods for better estimation of crop yield.
The advantage of whole plot harvest method is that it is almost bias-free since all sources of possible errors and biases associated with crop cut or farmers’ estimate are eliminated when the entire field is harvested. However, this involves a large volume of work to obtain robust estimates of yield at landscape level. Sampling of harvest units can be used on larger samples than is possible with crop-cut or whole plot harvest method. However, this method is unsuitable for crops with staggered harvesting.
Use of crop cards can be combined with farmers’ estimate for crops with multiple harvesting and staggered ripening. However, this is again very labour intensive and cannot be employed for large-scale surveys. Further, use of local unit of measurement by different farmers may introduce error in estimation. Use of allometric methods is limited to a certain number of crops such as banana and maize. In developed countries, purchasers’ records or crop insurance data may be used for crop yield estimation but this method may not be suitable in the context of smallholder production in developing countries.
Crop modelling and remote sensing are cost effective methods of yield estimation which can be employed at large scales fairly accurately although empirical models fails to capture landscape heterogeneity and process based models need rigorous parameterization, calibration and validation before they can be used for large scale estimation.
8.4 Conclusion
Precise estimation of crop yield in smallholder agriculture is challenging because of highly heterogeneous crop performance within a plot, continuous planting and intercropping or mixed cropping to meet various household requirements. Staggered ripening of many crops with an extended harvest period and planted area not being equal to harvested area further complicates the issue of crop yield determination in smallholder farmers’ condition. A wide range of methodologies have been developed to estimate crop yields in the smallholder production systems, each with advantages and disadvantages. This review has primarily considered the application of these methodologies to cereal cropping systems, but the methodologies can be adapted to other cropping systems as well. A choice of method depends on the objective and desired level of precision, scale of estimation and available resources. For example, whole plot harvesting may be suitable for small scale detailed studies at plot level whereas for large scale survey at regional level combination of crop cut, farmer’s estimation and expert assessment may be used. Use of crop models and remote sensing may be appropriate for agricultural statistics, provided adequate parameterization of models is done and imagery at sufficiently fine resolution to capture the variability of crops and their performance in smallholder fields is available.
Author affiliations
¹Tek B Sapkota. International Maize and Wheat Improvement Centre (CIMMYT). New Delhi, India. email: T.Sapkota@cgiar.org
2Borlaug Institute of South Asia, Pusa, Samastipur, Bihar- 848125, India
3International Maize and Wheat Improvement Centre (CIMMYT), United Kingdom
References
Toensmeir E (2012) Perennial Staple Crops of the world. Permaculture Activist (magazine).


